
Empty cells in a data range can make a chart plunge to zero or leave strange holes in a line. Here is how to make an Excel chart ignore blank cells so the chart shows only the values that exist. The fix takes less than a minute and uses a single setting in the Select Data dialog.
Key Takeaways
- The setting lives in Select Data, under the Hidden and Empty Cells button.
- Choose Gaps to leave blanks empty, or Connect data points with line to bridge them on line and scatter charts.
- Cells that look blank but hold a formula result may still plot as zero.
- Returning #N/A with the NA function from a formula is the reliable way to keep those cells off the chart.
Step-by-Step: Make an Excel Chart Ignore Blank Cells
This works best when the chart is already built and the blanks are the only problem. Think of it like telling a printer to skip empty pages instead of printing them as blank sheets.
- Step 1: Click anywhere on the chart to select it. The Chart Design tab appears on the ribbon.
- Step 2: On the Chart Design tab, click Select Data. Right-clicking the chart and choosing Select Data opens the same dialog.
- Step 3: In the Select Data Source dialog, click the Hidden and Empty Cells button in the lower-left corner.
- Step 4: Under Show empty cells as, pick Gaps. This leaves a break wherever a cell is empty instead of plotting a zero.
- Step 5: For a line or scatter chart where the line should stay continuous, pick Connect data points with line instead. The line then bridges each empty cell.
- Step 6: Click OK in the Hidden and Empty Cells dialog, then click OK again in the Select Data Source dialog. The chart updates right away.

Tip: Gaps is usually the default for a new chart, so if blanks still plot as zero, the cells probably are not truly empty. The next section covers that case.
Choosing Between Gaps, Zero, and Connect Data Points With Line
Most people find that the choice depends on what the data means. A sales tracker with a missing week reads honestly with a gap. A temperature log with one missed reading often looks better with a connected line. Zero is rarely the right pick unless an empty cell genuinely means none. Column and bar charts show only Gaps and Zero, because there is no line to connect.
Keep Formula Cells Off the Chart With #N/A
A common scenario: a formula such as an IF statement returns empty text for rows without data. Excel treats empty text as a text value, not a blank, so the chart plots it as zero no matter what the Hidden and Empty Cells setting says. The key is to return #N/A instead, because charts skip #N/A points.
- Step 1: Edit the formula so the no-data branch returns NA(). For example, =IF(B2=,NA(),B2*1.1) returns #N/A when B2 is empty and a calculated value otherwise.
- Step 2: Copy the formula down the full column so every row follows the same rule.
- Step 3: Select the chart, then open Chart Design, Select Data, and Hidden and Empty Cells.
- Step 4: In current versions of Excel for Microsoft 365, tick Show #N/A as an empty cell so the #N/A points follow the same Gaps or Connect setting as true blanks.
- Step 5: Click OK twice to apply the changes.
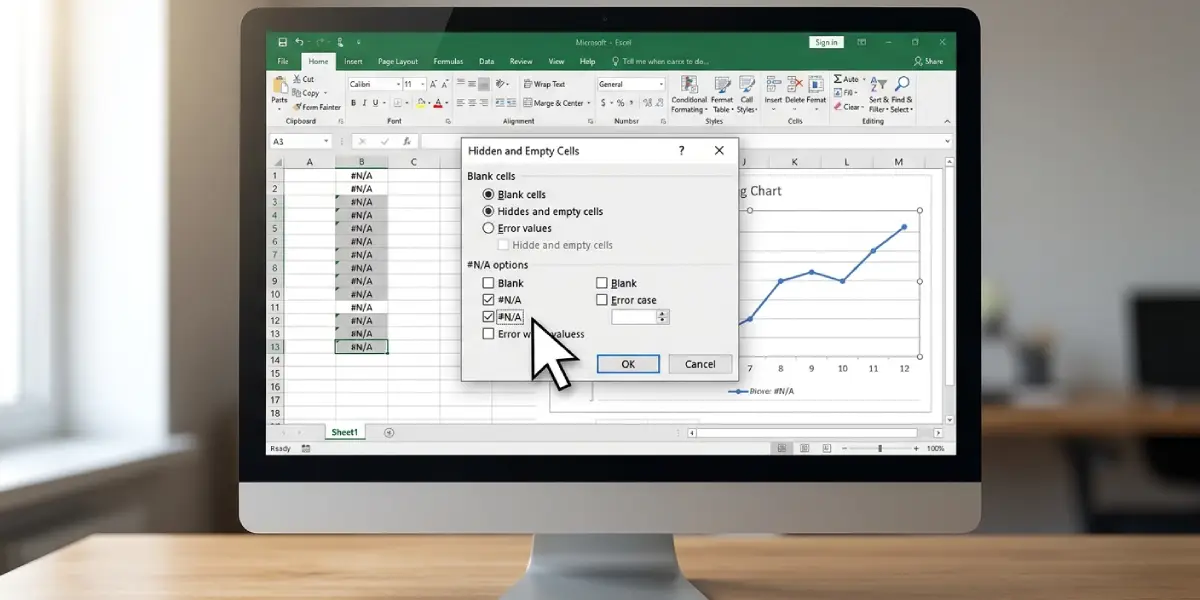
Tip: Cells showing #N/A look messy in the worksheet. Apply conditional formatting with a font color that matches the background, or point the chart at a separate helper column and leave the main table untouched.
Common Problems and Fixes
The chart still plots blanks as zero
The cells likely contain a formula returning empty text, or a space character. Clear the spaces, or switch the formula to return NA() as described above.
The Hidden and Empty Cells button is missing or does nothing
The button sits inside the Select Data Source dialog, not on the ribbon. If the chart is a pivot chart, the option may be limited, so check that a regular chart is selected.
The line still drops to zero between points
Confirm that Gaps or Connect data points with line is selected and not Zero. Then confirm the empty cells are truly empty and not holding a formula.
Connect data points with line is not available
That option appears only for line and scatter charts. Column, bar, and area charts offer Gaps and Zero.
Data in hidden rows has disappeared from the chart
By default, Excel does not plot data in hidden rows and columns. In the same Hidden and Empty Cells dialog, tick Show data in hidden rows and columns to bring it back.
Blanks reappear after the chart is copied to another file
Copying a chart can reset the setting. Reopen Select Data and Hidden and Empty Cells in the new file and choose the option again.
Frequently Asked Questions
How do I make an Excel chart ignore blank cells?
Select the chart, open Chart Design, click Select Data, then click Hidden and Empty Cells and choose Gaps. Click OK twice to apply it.
Why does my Excel chart show zero for empty cells?
Either the Show empty cells as option is set to Zero, or the cells contain a formula or space that Excel treats as a value rather than a true blank.
What is the difference between Gaps and Connect data points with line?
Gaps leaves a visible break in the chart at each empty cell. Connect data points with line draws a line across the empty cell, joining the neighboring points.
Why does the chart still plot cells that look empty?
Cells that return empty text from a formula are not blank to Excel, so they plot as zero. Returning NA() from the formula keeps them off the chart.
How do I use #N/A to hide points in a chart?
Change the formula so the no-data case returns NA(). Charts skip #N/A values, and in current Microsoft 365 builds the Show #N/A as an empty cell option makes them follow the Gaps or Connect setting.
Can a column chart connect across blank cells?
No. Connect data points with line is available only for line and scatter charts. Column charts offer Gaps and Zero.
Does deleting the blank rows fix the problem?
It does, but only by removing the rows. The Hidden and Empty Cells setting is better when the blanks need to stay in the sheet for later data entry.
Why is data from hidden rows missing from my chart?
Excel skips hidden rows and columns by default. Tick Show data in hidden rows and columns in the Hidden and Empty Cells dialog to include them.