
A sluggish PC rarely fails without leaving clues, and knowing how to use Task Manager to diagnose slowdowns is the fastest way to find them. This built-in Windows tool shows exactly which process, resource, or startup program is dragging performance down. No extra software is needed, and the whole process usually takes just a few minutes.
Key Takeaways
- Task Manager reveals which app or process is consuming CPU, memory, disk, or network resources in real time.
- The Processes tab is the starting point for spotting anything using an unusual share of a resource.
- The Performance tab shows whether the bottleneck is the CPU, RAM, storage drive, or GPU.
- The Startup tab often uncovers the real cause of a slow boot or a system that feels sluggish right after logging in.
- Consistently high usage from one resource, rather than a brief spike, is the pattern worth acting on.
Before You Start
This is a software diagnostic task, so there is no need to power down the machine or open the case. A few small habits make the process smoother.
- Save any open work before closing or ending processes, since forcing an app to close discards unsaved changes.
- Let the PC sit idle for a minute or two before checking, so background tasks like updates or indexing settle down and do not skew the readings.
- Log in with an administrator account if possible, since some processes and startup settings are hidden or locked otherwise.
How to Use Task Manager to Diagnose Slowdowns
The steps below walk through the same workflow a technician follows when a customer says the computer ‘just feels slow.’
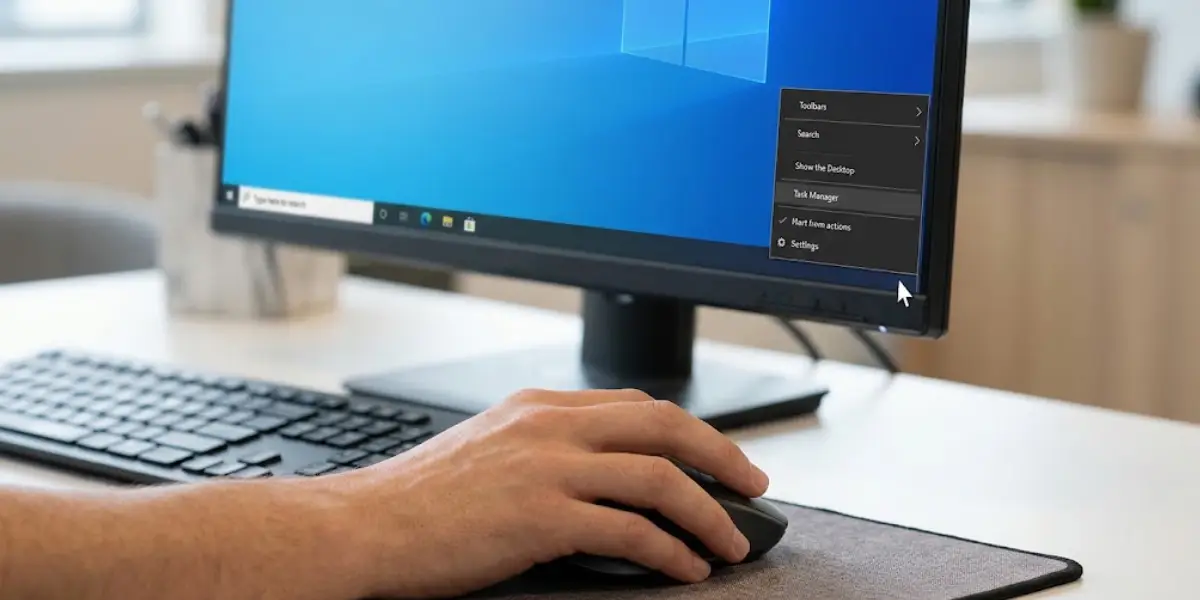
- Step 1: Open Task Manager by right-clicking the taskbar and selecting ‘Task Manager,’ or by pressing Ctrl+Shift+Esc.
- Step 2: Click ‘More details’ if the window opens in the compact view, to reveal the full set of tabs and columns.
- Step 3: Select the ‘Processes’ tab and click the ‘CPU’ column header to sort from highest to lowest usage. Watch it for about ten to fifteen seconds rather than judging from a single instant, since usage naturally spikes and dips.
- Step 4: Sort by the ‘Memory’ column next. A browser with dozens of tabs or a single app quietly climbing in memory use over time is a common culprit here.
- Step 5: Sort by the ‘Disk’ column, especially if the drive is a mechanical hard drive rather than an SSD. Heavy, sustained disk activity from a background process is a classic sign of slow file access and general lag.
- Step 6: Move to the ‘Performance’ tab and click through CPU, Memory, Disk, and GPU on the left side. Each graph shows utilization over time, making it easy to see whether one resource is consistently maxed out.
- Step 7: On the CPU page of the Performance tab, note the ‘Base speed’ and current clock speed. A CPU running well below its base speed under load can point toward thermal throttling rather than a software issue.
- Step 8: Check the ‘Startup apps’ tab (or ‘Startup’ on older Windows versions) and look at the ‘Startup impact’ column. Programs marked ‘High’ that are not actually needed at boot are frequent contributors to a slow start.
- Step 9: Right-click any process that stands out as unusually heavy and choose ‘End task’ only if it is safe to close, or research the process name first if it is unfamiliar.
- Step 10: Disable non-essential startup programs from the Startup apps tab by selecting them and clicking ‘Disable,’ then restart the PC to confirm whether boot times and general responsiveness improve.
Tip: If usage on every tab looks normal but the system still feels slow, the bottleneck may be intermittent, so leave Task Manager open and minimized while working normally for a while to catch the spike as it happens.
Reading the Resource Monitor for More Detail
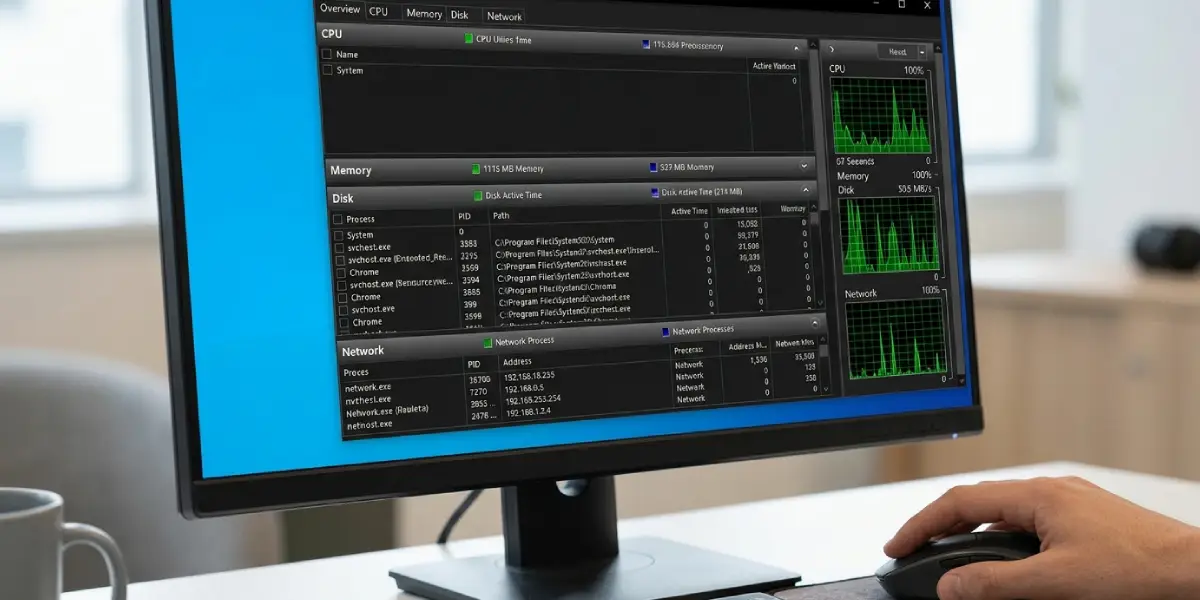
When Task Manager points to high disk or network usage but does not clearly show which process is responsible, open Resource Monitor by clicking the link at the bottom of the Performance tab, or by typing ‘resmon’ into the Windows search bar. It breaks activity down by individual file and network connection, which is useful when several processes share a similar name.
Common Problems and Fixes
- A process labeled ‘System’ or ‘System Idle Process’ shows high CPU use. This is normal background behavior in most cases, not a rogue app, and rarely needs any action.
- Task Manager itself feels slow or unresponsive while open. This usually happens on a system already under heavy strain. Let it run for a minute before assuming the tool is broken.
- Ending a task does not free up resources. Some processes relaunch automatically because they are tied to a service. Disable the related service or startup entry instead of repeatedly ending the task.
- Disk usage sits at or near 100 percent constantly. On an older mechanical hard drive, this can simply reflect its age and speed rather than a specific fault, and upgrading to an SSD often resolves it.
- A driver or background process is unfamiliar and hard to identify. Right-click it and choose ‘Open file location’ to see where it lives on the drive, which helps confirm whether it belongs to a legitimate program.
Frequently Asked Questions
What is the fastest way to open Task Manager?
Press Ctrl+Shift+Esc, which opens Task Manager directly without going through the taskbar or Start menu.
Which tab should be checked first when a PC feels slow?
The Processes tab is the best starting point, since sorting by CPU, memory, or disk quickly reveals anything using an unusual share of a resource.
Is it safe to end any process shown in Task Manager?
No. Ending a task tied to Windows itself or a driver can cause instability. It is safer to close recognizable applications and research anything unfamiliar before ending it.
Why does CPU usage jump around instead of staying steady?
Modern CPUs constantly adjust their workload based on demand, so brief spikes are normal. A consistently high reading over an extended period is the pattern worth investigating.
What does high disk usage in Task Manager usually mean?
It typically means a process is reading or writing a large amount of data, which can come from indexing, updates, or a program with a memory leak spilling over into disk activity.
Can Task Manager show if the PC is overheating?
Not directly, but a CPU running well below its listed base speed under load, visible on the Performance tab, can be an indirect sign of thermal throttling.
How can startup programs be identified as safe to disable?
Focus on programs that are not needed immediately at login, such as media players, chat apps, or software update checkers. Anything unrecognized is worth a quick search before disabling it.
Does Task Manager show background processes as well as open apps?
Yes, the Processes tab lists both visible applications and background processes together, often grouped under ‘Apps,’ ‘Background processes,’ and ‘Windows processes.’
Why does memory usage keep climbing the longer the PC stays on?
This often points to a memory leak in a specific application. Sorting the Processes tab by memory and watching it over time usually identifies the source.
Is there a tool that gives more detail than Task Manager?
Resource Monitor, accessible from a link on the Performance tab, breaks resource use down by individual file and connection for cases where Task Manager alone is not specific enough.